Gathering Metrics from Kubernetes with Prometheus and Grafana
Brian McClain
You have your Kubernetes cluster up, it’s running your applications, and everything seems to be running great. Your work is done, right?
If only it was that simple. Running in production means keeping a close eye on how things are performing, so having data that provides such insight is important. After all, being able to recognize potentially problematic patterns in how your applications are performing or how Kubernetes is handling specific workloads can mean the difference between making a quick fix and getting a call at 3 a.m. because your website is down.
Two open source tools that can help with this are Prometheus and Grafana. Prometheus excels at gathering metrics from a wide array of sources, while Grafana is the go-to tool for visualizing complex time-series data. These two tools working in tandem are very powerful, and are very easy to install and use!
In this guide, you’ll be setting up Prometheus and Grafana on an existing Kubernetes cluster, as well as setting up a dashboard in Grafana to visualize the data gathered from that cluster. You can use any Kubernetes installation of your choosing, whether it’s hosted on a cloud provider or even something like Minikube running on your local machine.
Installing Prometheus
Luckily, there’s a comprehensive Helm chart for Prometheus with an extensive list of configuration options. If you’re not familiar with Helm, make sure to check out Helm: What Is it? and Getting Started With Helm. For this walkthrough, you’ll be keeping things fairly straightforward, so if you’ve used Helm before, or are just starting to learn, you will have seen most of what’s in this guide.
To install Prometheus, you first need to add the Bitnami Helm repository by
using the helm repo add command followed by the helm repo update command to
pull in the latest metadata:
helm repo add bitnami https://charts.bitnami.com/bitnami
helm repo update
Before you install Prometheus, check out the
configuration options
you have, because there are a lot of them. In this example, it’s assumed that
you’ll be installing with the default configuration into a Kubernetes cluster
with no specific requirements. As you can see, there are options for everything
from how each component is exposed (i.e., the type of ingress used, if it’s
behind a load balancer, etc.) to how data is stored and more. If this was a
production installation, you’d want to thoroughly sort out these options, but
for the purposes of this demo, you can install Prometheus with the default
configuration using the helm install command:
helm install prometheus bitnami/kube-prometheus
After a few moments, you’ll see a few new pods created:
alertmanager-prometheus-prometheus-oper-alertmanager-0   2/2     Running   0          25m
prometheus-kube-state-metrics-68cb46fdd4-gk4jh           1/1     Running   0          25m
prometheus-node-exporter-rkg84                           1/1     Running   0          25m
prometheus-prometheus-oper-operator-745f4b599c-xjjsn     1/1     Running   0          25m
prometheus-prometheus-prometheus-oper-prometheus-0       3/3     Running   1          25m
There are a few ways you can access Prometheus, but it largely depends on how
your Kubernetes cluster is configured. As the Prometheus documentation points
out, traditionally you would expose the server through a reverse proxy, such as
nginx. But since the default configuration of the Prometheus Helm chart only
exposes it to other pods in the Kubernetes cluster, you can instead take
advantage of the kubectl port-forward command. Open a new terminal and keep it
open after running the following:
kubectl port-forward --namespace default svc/prometheus-kube-prometheus-prometheus 9090:9090
Great! The above command forwards all traffic to port 9090 on your machine to
the prometheus-server pod, which you can see by visiting
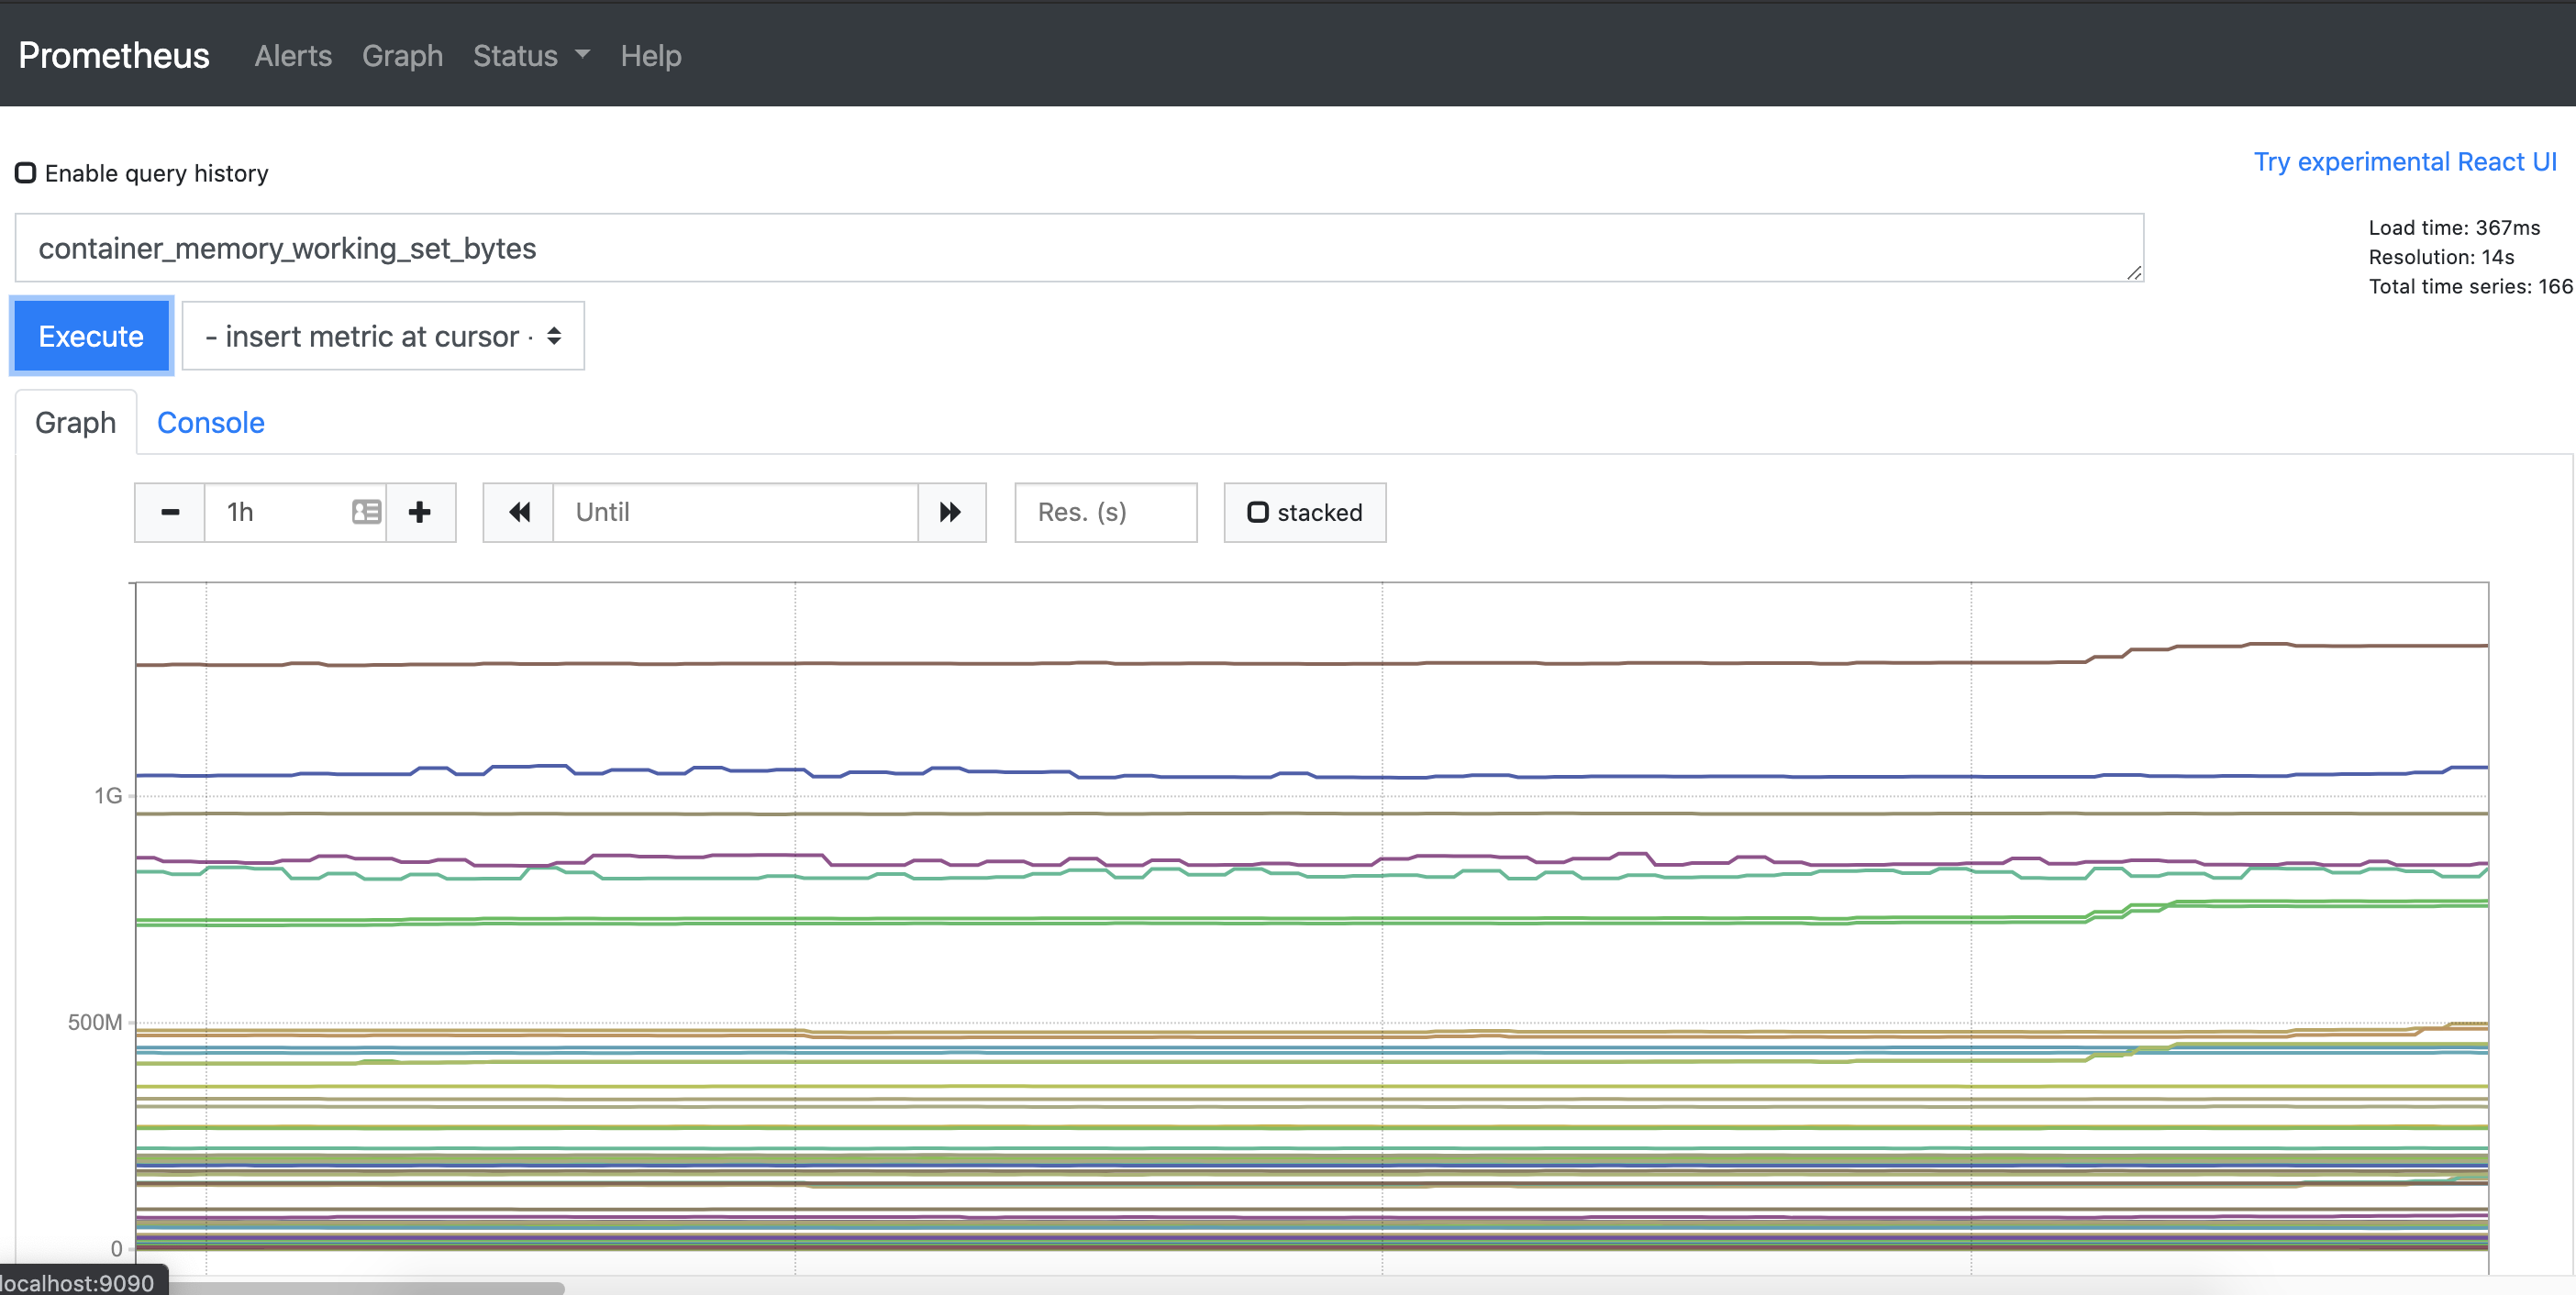
http://localhost:9090.

Installing Grafana
Much like Prometheus, Grafana has a great
Helm chart for installing it.
Again, you’ll see a plethora of configuration options to tweak the installation
to your needs, but for this demo, you can just install it with the default
configuration to see it in action. You can install the bitnami/grafana Helm
chart with the following command:
helm install grafana bitnami/grafana
After a few moments, you’ll see a new pod created:
grafana-66c98bcb86-xpd5t 1/1 Running 0 2d23h
There’s one additional step you’ll need to take. The Grafana Helm chart generates a random password for you and stores it as a secret in Kubernetes. You can retrieve this password by running the following command:
echo "$(kubectl get secret grafana-admin --namespace default -o jsonpath="{.data.GF_SECURITY_ADMIN_PASSWORD}" | base64 --decode)"
Note the password, as you’ll be needing it shortly. Like the Prometheus install,
you may have different requirements or capabilities for exposing services
outside of your Kubernetes cluster, but you can again use the
kubectl port-forward command. Open a new terminal and run:
export POD_NAME=$(kubectl get pods --namespace default -l "app.kubernetes.io/name=grafana,app.kubernetes.io/instance=grafana" -o jsonpath="{.items[0].metadata.name}")
kubectl --namespace default port-forward $POD_NAME 3000
With this command running, you can now access Grafana at
http://localhost:3000! You’ll be prompted for a
username, which by default is admin, along with the password you just
retrieved. Though when you log in, you may notice that things are a bit bare.
That’s because, while Prometheus is automatically gathering metrics from your
Kubernetes cluster, Grafana doesn’t know anything about your Prometheus install.
It does, however, know how to speak to a Prometheus server, and makes it very
easy to configure it as a data source.
Visualizing Prometheus Data in Grafana
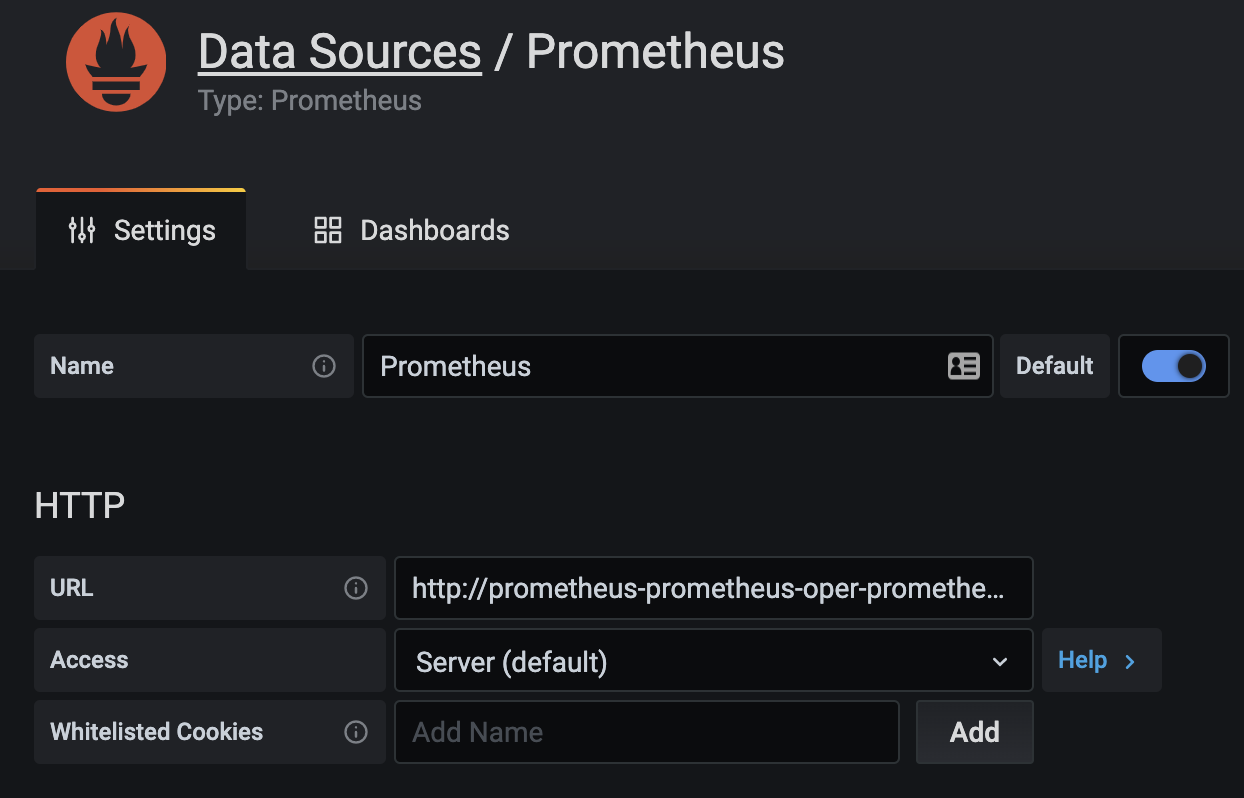
If you mouse over the cogwheel on the left-hand side of the Grafana screen, you’ll be prompted with several configuration options. Choose “Data Sources,” followed by “Add data source.” Here, you’ll see a long list of data sources that Grafana knows how to talk to automatically, and luckily Prometheus is on that list. Choose “Prometheus” and you’ll be brought to the configuration screen for your new data source.
If you didn’t change the default configuration when installing Prometheus,
you’ll only need to give it a name of your choosing, as well as the URL where
Prometheus is running. Since both are running in the same cluster, you can
connect Grafana to Prometheus using the internal DNS to Kubernetes by providing
it the service name that Prometheus is connected to:
http://prometheus-kube-prometheus-prometheus.default.svc.cluster.local:9090

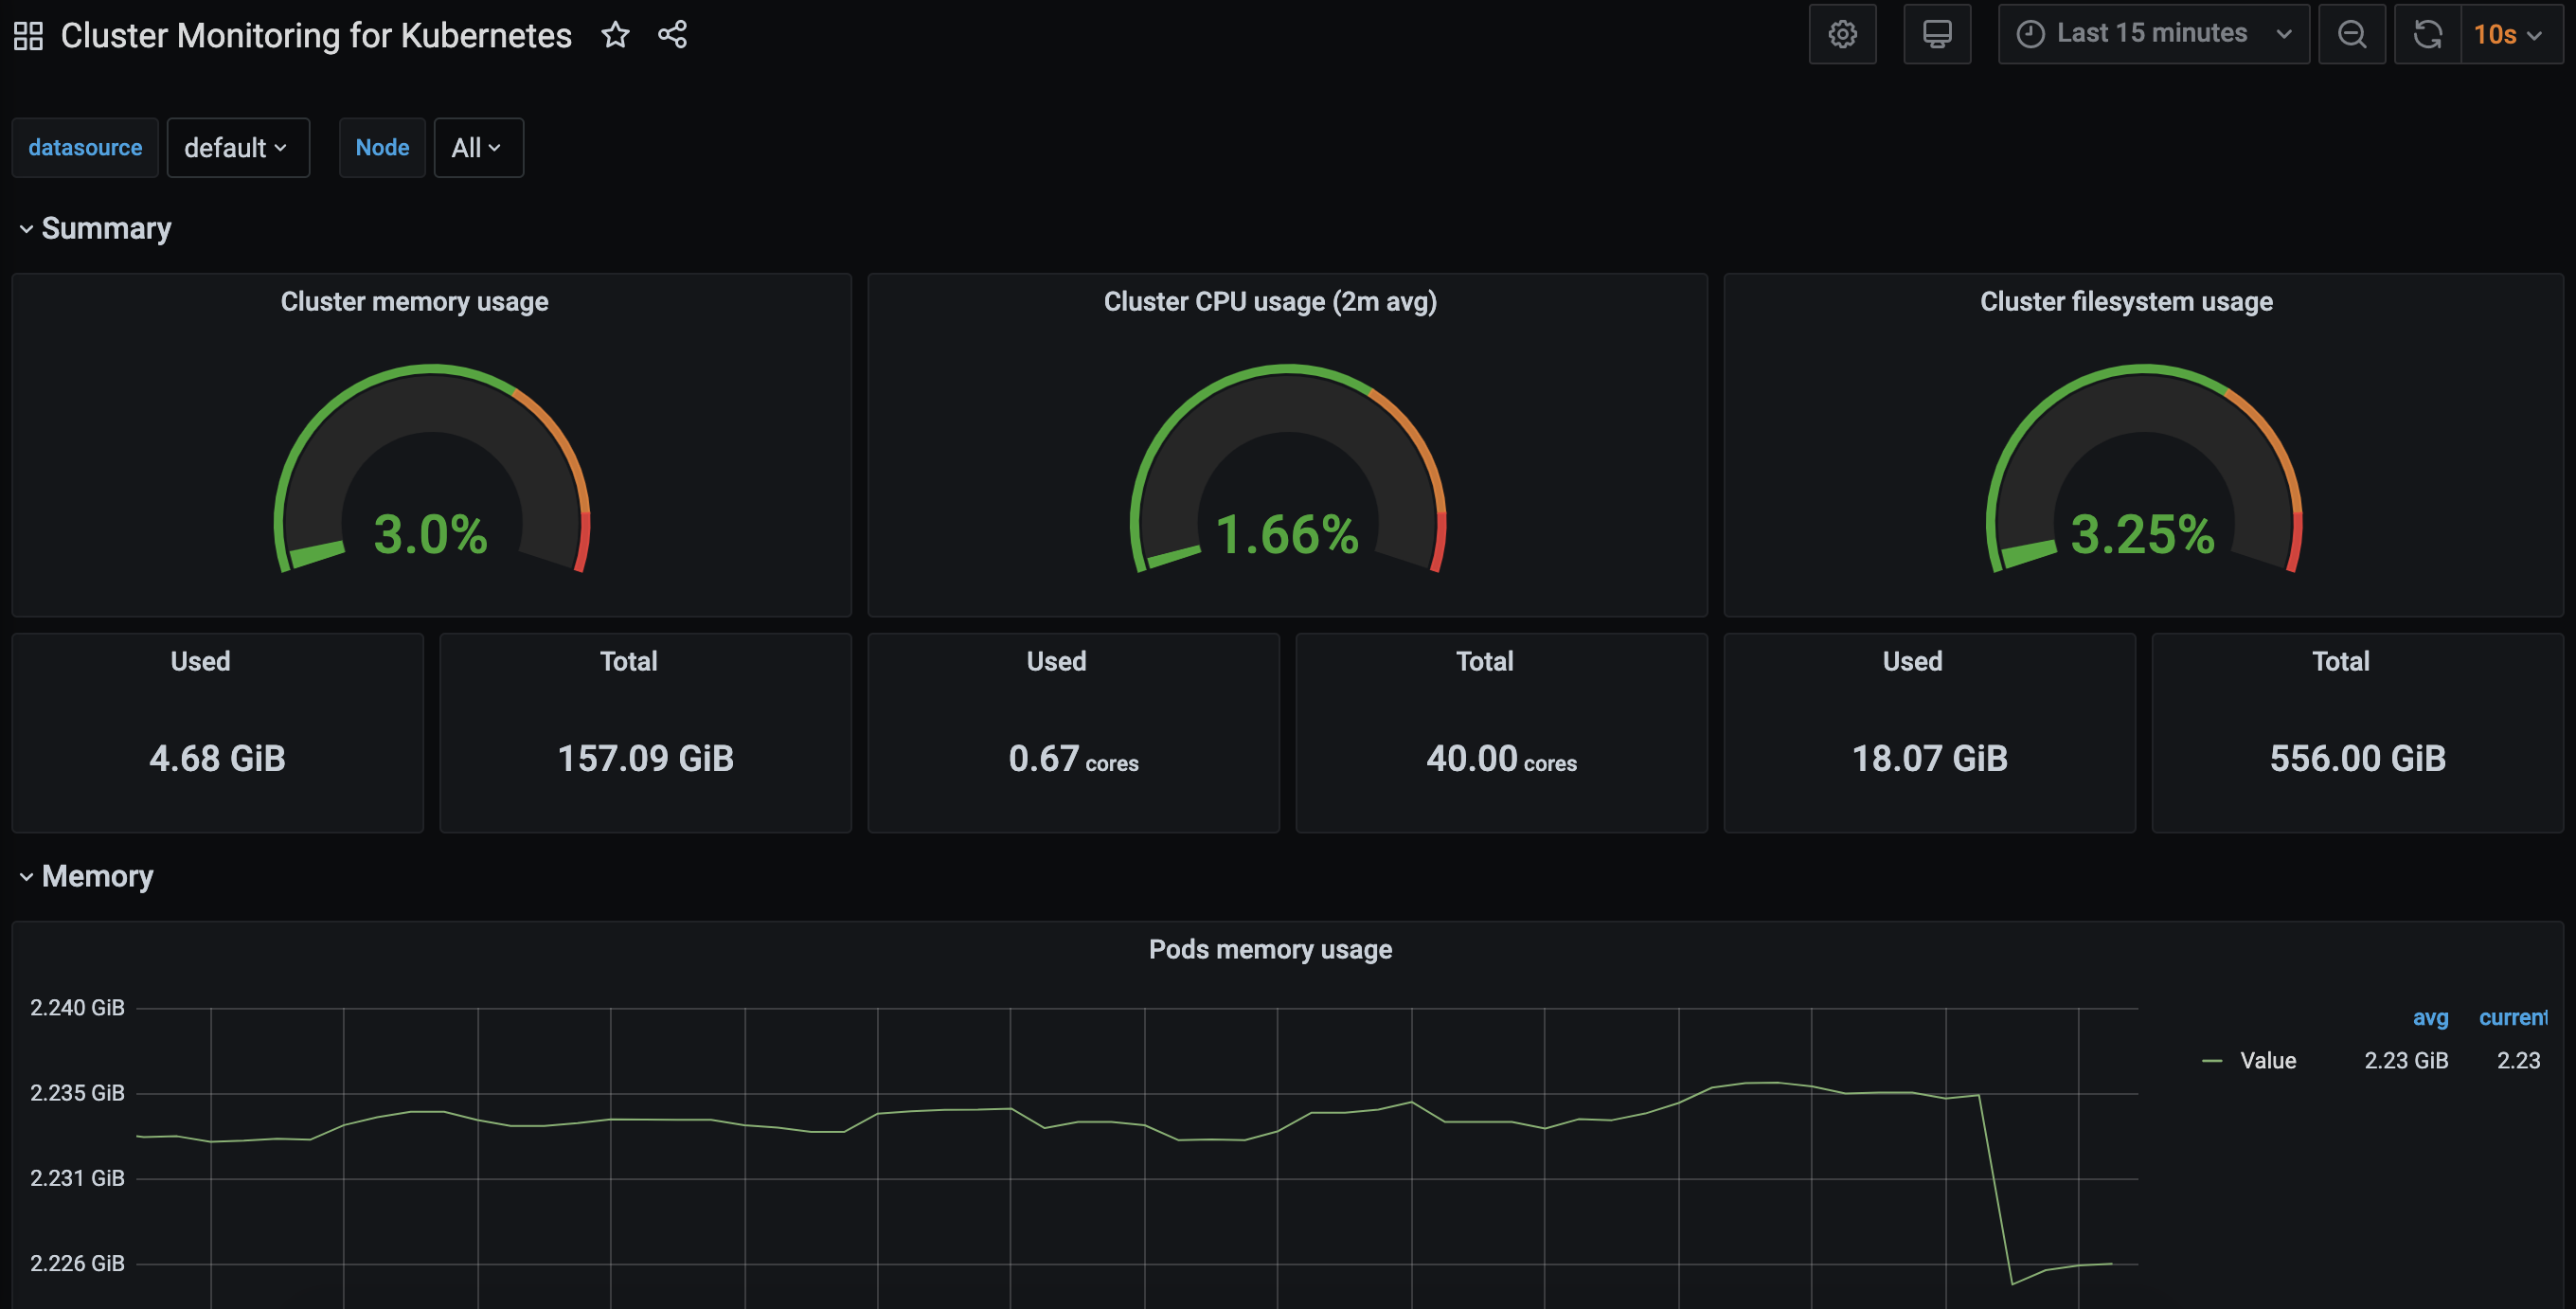
If you’re already familiar with creating dashboards and panels in Grafana, you’re all set! However, if you’re new to Grafana, don’t worry; this is where you can once again look to the great community for information about these tools. The Grafana website has a huge repository of dashboards that can be easily shared and imported into your own Grafana installation. And all you need in order to import one of these dashboards from the Grafana site is a single ID number. Take this dashboard, for example. You can see that it has an ID of “10000.”
To import this dashboard, mouse over the “Dashboards” section on the left-hand side of the Grafana screen (the icon is four squares) and choose “Manage.” On the top right of the dashboard management screen, click “Import” and you’ll be prompted for the URL, ID, or JSON for the dashboard that you wish to import. Under “Import via grafana.com,” enter “10000,” matching the ID of the dashboard that you wish to import. Feel free to change the name or the unique identifier, but the one thing you must provide is the data source, which is asked for on the bottom of the configuration screen. Choose your Prometheus data source, click “Import,” and you will be greeted by your newly created, but fully populated, dashboard!

What’s Next?
The great news is that any data gathered from Prometheus can be used in Grafana. That means any pod with the proper annotations will automatically get scraped by Prometheus. Many languages and frameworks have libraries that support exposing metrics that Prometheus can gather, including Spring. Make sure to check out the libraries available for your language of choice! Additionally, if you’re looking to learn more about observability and how to get better insight into your applications, make sure to check out our growing collection of guides.
Frequently Asked Questions
What are Bitnami Helm charts?
Bitnami offers automated application deployments of open source server apps and allows developers to deploy an application using Bitnami’s Helm charts.
What is the difference between Prometheus and Grafana in Kubernetes?
Prometheus and Grafana are two open source tools. Prometheus excels at gathering metrics from a wide array of sources, while Grafana is the go-to tool for visualizing complex time-series data.
How do you install Prometheus using Helm for Kubernetes?
To install Prometheus, you must start with the Bitnami Helm repository. Please refer to the section above titled ‘Installing Prometheus’ for specific commands that need to be installed.
How do you install Grafana using Helm for Kubernetes?
There are many configuration options when installing Grafana. For a thorough walkthrough of installing bitnami/grafana Helm chart, refer to the section above titled ‘Installing Grafana.’
Can you use data in both Prometheus and Grafana?
Yes, any data gathered from Prometheus can be used in Grafana, meaning any pod with the proper annotations will automatically get scraped by Prometheus.