Tracing a Reactive Kotlin App with Spring Cloud Sleuth and OpenZipkin
Mario Gray
This guide will discuss RSocket tracing with Spring Cloud Sleuth and Zipkin. We will ship data to Zipkin through HTTP/REST, Kafka, and RabbitMQ. This guide will inform you of the additional configuration carried out when configuring for distributed tracing on a Spring Boot 2.7.x/Reactive application.
Motivation
So, you might think: I have a reactive application built with Spring Boot, but I want to discover performance characteristics and have a mindset of resiliency. Then you embark on the tried and true method of ‘google hunting’ and arrive at Spring Cloud Sleuth, and you would be correct!
Spring Cloud Sleuth represents an overlay component between the app and a tracing library. It is based heavily on the Brave library but focuses on enrichment to mix in trace logic. We want to utilize a tracing library and not have to make invasive modifications to our application.
How Tracing Differs From Metrics
It is usually about this section when you may ask yourself “what about micrometer metrics - isn’t that the same or better?”. But they are not the same; here is why and how.
Metric data consists of linear time-series aggregates that correspond to the conductance of one resource-specific dimension over time. It tells you (for example) how much throughput of requests and latency that were observed on a single service throughout a time span. Additionally, this gives you the power to leverage the distribution of these statistics to scale your application accordingly and determine best-case/worst-case user experiences.
Tracing data will give detailed information about the single request, but not all, because only a fraction of requests is recorded. You will be able to understand how a request is behaving with specific sets of input and gain insights into how service routes affect each other.
To Trace or Not to Trace
You’ve come here because you’re curious about this ’tracing’ component, and you want to learn how to integrate it into your existing Spring Boot projects. Here are some tips to know whether you need tracing.
- Re-writing legacy apps or embarking on a new project.
- An Inter-connected microservices project that lacks tracing.
- Monitoring specific service zones ( regions, etc ) for hotspot activity.
This guide helps to answer the following questions:
- How can I guarantee what is being traced, and how do I enable it?
- What is needed to send traces somewhere that operators can visualize?
- What are my options in sending trace data to a collection server?
A Few Notes on Tracing Technology
Maybe the next question you will ask about tracing: what the heck IS a Span and Trace?
Let’s get through some nomenclature to help understand what will happen in context at the application level. Check out this Getting Started Guide that will prepare you further for a deeper understanding. For now, here are the basics.
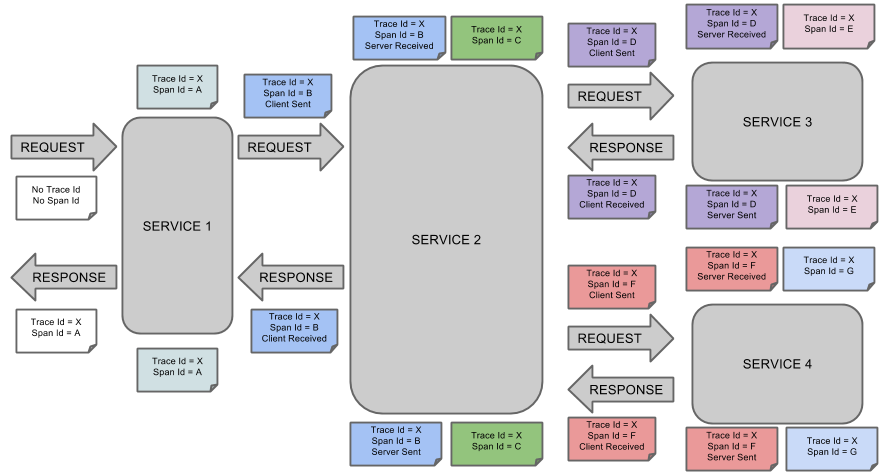
Tracing is the concept that describes how our application identifies a single signal/request from one component to the next, until the terminus. Tracers do the work of applying tracing logic to a component, and propagating a unique trace ID where the signal originated ( e.g. HTTP POST endpoint ). A unique spanId gets assigned to the trace for each component this signal touches. Thus, a trace represents the entire scope of a signal, and a span represents the individual component such signal passed through.
A Trace is a set of spans forming a tree-like structure. For example, if you run a distributed microservice constellation, a trace might be formed at the edge from a GraphQL API or REST Controller.
Spans also have other data, such as descriptions, timestamped events, key-value annotations (tags), the ID of the span that caused them, and process IDs (normally IP or MAC addresses). Spans can be started and stopped, and they keep track of their timing information. Once you create a span, you must stop it in the future.
Distributed tracing platforms like OpenZipkin record trace data. Trace data is composed of a parent:child tree structure called a Directed Acyclic Graph
(DAG for short). A root node represents the trace or overall journey, and each
span represents an individual hop along the service route. To illustrate better, I
have included an ASCII diagram from [https://github.com/openzipkin/zipkin](OpenZipkin github).
   Client Tracer                                                  Server Tracer
┌─────────────────-----─┐                                       ┌────────────────-----──┐
│                       │                                       │                       │
│   TraceContext        │           Http Request Headers        │   TraceContext        │
│ ┌─────────────-----─┐ │          ┌───────────────────┐        │ ┌────────────-----──┐ │
│ │ TraceId           │ │          │ X─B3─TraceId      │        │ │ TraceId           │ │
│ │                   │ │          │                   │        │ │                   │ │
│ │ ParentSpanId      │ │ Extract  │ X─B3─ParentSpanId │ Inject │ │ ParentSpanId      │ │
│ │                   ├─┼─────────>│                   ├────────┼>│                   │ │
│ │ SpanId            │ │          │ X─B3─SpanId       │        │ │ SpanId            │ │
│ │                   │ │          │                   │        │ │                   │ │
│ │ Sampling decision │ │          │ X─B3─Sampled      │        │ │ Sampling decision │ │
│ └──────────-----────┘ │          └───────────────────┘        │ └────────────-----──┘ │
│                       │                                       │                       │
└────────────────-----──┘                                       └───────────────-----───┘
For further visualization of what a span and trace logically look like:
The Sleuth Library includes support for Managing Spans with annotations. Per the doc, this benefits developers by:
- Being API-agnostic means to collaborate with a span. Use of annotations lets users add to a span with no library dependency on a span api. Doing so lets Sleuth change its core API to create less impact to user code.
- Reduced surface area for basic span operations. Without this feature, you must use the span api, which has lifecycle commands that could be used incorrectly. By only exposing scope, tag, and log functionality, you can collaborate without accidentally breaking span lifecycle.
- Collaboration with runtime generated code. With libraries such as Spring Data and Feign, the implementations of interfaces are generated at runtime. Consequently, span wrapping of objects was tedious. Now you can provide annotations over interfaces and the arguments of those interfaces.
Once you have Spring Cloud Sleuth on the classpath, it will automatically instrument common communication channels such as:
- Messaging like Kafka or RabbitMQ
- HTTP headers via WebMVC and WebFlux controllers
- Request headers made through
WebClient, andRestTemplate
Demo Application
The code presented here can be cloned from this git repository. This example will trace RSocket messaging routes and requests. This project starts at every Spring Developer’s favorite place: start dot spring dot io, and requires just a few select dependencies:
- Sleuth - For tracing instrumentation.
- RSocket - For exposing reactive messaging endpoints.
- Zipkin client - For interacting with the zipkin daemon later on.
- Using The latest GA Spring Boot or your preference.
- Using JVM 17.
- Kotlin
NOTE: If you are familiar with reactive basics this next sections will make sense, otherwise I implore you to watch the video or even head to spring.io for a refresher.
Its easiest to follow along in your favorite IDE as we will sample test classes individually. Or if you want, just use Maven to run a single test by editing the following command:
mvn -Dtest=ManualSpanTests test
Changing the test class to the one in focus later in this guide is all that is needed. Additionally, you
might want to save output using the > filename operator in your favorite shell, which makes for easy
grepping of log lines. There will be little grepping for output specifics.
Next, we will dive into the subject of tracing Reactive components with Sleuth.
Reactive Component Participation
When you add spring-cloud-sleuth to the classpath, Spring’s autoconfiguration does a few things to instrument the application. In regards to the Reactive stack, Spring employs a few key autoconfiguration classes:
-
TraceReactorAutoConfiguration for instrumenting reactor components; how reactor operators gets decorated. It uses the
InstrumentationType(described below) to make decisions on where to trace. -
TracingRSocketConnectorConfigurer for instrumenting the RSocket client/server connections.
Most notably are the configuration properties such as SleuthRSocketProperties that will be used to determine if/where Sleuth will instrument reactive streams.
One such class: SleuthReactorProperties tells sleuth where to decorate reactor operators. It enables several styles of operator decoration as outlined below.
This is expressed through the property enum class InstrumentationType which gives a few options on when instrumentation happens in reactive streams as described below:
Settings for spring.sleuth.reactor.instrumentation-type:
-
DECORATE_QUEUES Utilizes Reactor’s queue-wrapping mechanism to instrument the way threads are switched by Reactor. This offers low performance impact. Available after Spring Boot 2.4.3
-
DECORATE_ON_EACH Every operator is wrapped. This method will pass a tracing context in most cases, and thus may bear major performance implications.
-
DECORATE_ON_LAST Only the last operator is wrapped in a trace. This passes the trace context in some cases, and may even cause MDC to not work (for your SLF4J logs). The performance penalty is medium in this mode. This method is also marked for deprecation.
-
MANUAL Wraps every operator in the least invasive way, does not pass a tracing context. That is up to the user.
NOTE: To opt-out of tracing altogether, its best to set the value of
spring.sleuth.rsocket.enabledto false. Alternatively you can configure yourRSocketRequesterandRSocketServerby hand - autoconfiguration will leave them alone if they’re already present.
Sleuth and Kotlin
Because Kotlin is the language used in this example - developers have been keen to use coroutines as opposed to raw reactive publishers - I’m happy to say that Sleuth supports coroutines!
The basics are exactly the same as with ordinary publisher usage, so we wont be going into that in this example. However, the repository containing this example does highlight usage of controllers declared with the suspend keyword. Additionally there are tests to compare output (hint: it’s the same).
Back to The Demo
You will need to decide an application name as it will appear in trace logs. Also decide on an instrumentation strategy that fits with your use case.
Those settings and more can be applied in application.properties:
application.properties:
spring.sleuth.rsocket.enabled=true
spring.sleuth.reactor.instrumentation-type=MANUAL
spring.application.name=EDDIEVALIANT
spring.rsocket.server.port=10001
#...
Additionally per the above, we also set the server port and explicitly enabled sleuth on RSocket. I also chose MANUAL instrumentation-type because it is least invasive, and allows us to ‘stack up’ on tracing capabilities as we need.
Next step is to create a couple of messaging endpoints:
SimpleTracedController.kt:
@Controller
class SimpleTracedController {

    @MessageMapping("justMono")
    fun requestResponse(): Mono<String> = Mono.just("olleh")

    @MessageMapping("justMonoNewSpan")
    @NewSpan("justMonoNewServerSpan")
    fun newSpanRequestResponse(): Mono<String> = Mono.just("olleh")
 //...
}
Without going into too much detail, we can see that we have exposed a couple of message routes - justMono and justMonoNewSpan - whereas the latter endpoint utilizes @NewSpan annotation to mark that endpoint in its own span per documentation:
“Allows to create a new span around a public method. The new span will be either a child of an existing span if a trace is already in progress or a new span will be created if there was no previous trace”.
Finally, we should enable debug logging. For wiretap debugging of RSocket connections, we can set the RSocket FrameLogger scope to debug. Also, we can see what the trace instrumentation is doing by setting trace debugging to the logging.level.org.springframework.cloud.sleuth.instrument package:
application.properties
#...
logging.level.io.rsocket.FrameLogger=DEBUG
logging.level.org.springframework.cloud.sleuth.instrument=trace
Tests for Traced Services
We’ll write some tests using JUnit 5, AssertJ, and reactive-tests components. But first we need to re-use an RSocketRequester in tests, so it is easier subclass the configuration of this component and remove some boilerplate in each test.
The following listing shows our test Superclass.
TestBase.kt
@TestInstance(TestInstance.Lifecycle.PER_CLASS)
@SpringBootTest
class TestBase {

    lateinit var requester: RSocketRequester

    private val log: Logger = LoggerFactory.getLogger(this::class.java)

    @BeforeAll
    fun setUp(@Autowired
              builder: RSocketRequester.Builder,
              @Value("\${spring.rsocket.server.port:0}")
              serverPort: String
    ) {
        requester = builder.tcp("localhost", serverPort.toInt())
    }

    @Test
    fun contextLoads() {
    }
}
This TestBase class forms the configuration for all our downstream tests. It simply uses @SpringBootTest for full autoconfiguration - with service exposition - and then connects to the local RSocket server with RSocketRequester.
Next, lets write a couple tests that will invoke our messaging endpoints. The first ones will log just the payloads, their traceId, and spanId. By default, traces will ship to zipkin via HTTP/REST unless no zipkin server is available.
The Unit Tests
The test that follows will demonstrate minimum instrumentation from the client side. Because this requester is not instrumented, the application will generate a single span originating only at the server.
ManualSpanTests.kt:
class ManualSpanTests : TestBase() {

    @Test
    fun `no trace is sent with request`() {
        val unTracedRequester = RSocketRequester.builder().tcp("localhost", 10001)

        StepVerifier.create(
                unTracedRequester
                        .route("justMonoNewSpan")
                        .retrieveMono<String>()
        )
                .assertNext {
                    Assertions
                            .assertThat(it)
                            .isNotNull
                            .contains("olleh")
                }
                .verifyComplete()
    }
    // ...
}
Running the test will generate some output from the FrameLogger on the requester side:
DEBUG [EDDIEVALIANT,,] 93802 --- [actor-tcp-nio-3] io.rsocket.FrameLogger                   : sending ->
Frame => Stream ID: 1 Type: REQUEST_RESPONSE Flags: 0b100000000 Length: 29
Metadata:
         +-------------------------------------------------+
         |  0  1  2  3  4  5  6  7  8  9  a  b  c  d  e  f |
+--------+-------------------------------------------------+----------------+
|00000000| fe 00 00 10 0f 6a 75 73 74 4d 6f 6e 6f 4e 65 77 |.....justMonoNew|
|00000010| 53 70 61 6e                                     |Span            |
+--------+-------------------------------------------------+----------------+
Without a trace in context from the requester, the server will create one anew. This trace will not get propagated back to the client. We will see output from the server as such:
DEBUG [EDDIEVALIANT,0eb1253f5539d5a0,0eb1253f5539d5a0] 93802 --- [ctor-http-nio-5] io.rsocket.FrameLogger                   : sending ->
Frame => Stream ID: 1 Type: NEXT_COMPLETE Flags: 0b1100000 Length: 11
Data:
         +-------------------------------------------------+
         |  0  1  2  3  4  5  6  7  8  9  a  b  c  d  e  f |
+--------+-------------------------------------------------+----------------+
|00000000| 6f 6c 6c 65 68                                  |olleh           |
+--------+-------------------------------------------------+----------------+
As expected, the server created its span and thus starts and ends the trace as there are no downstream components.
Sleuth Tracer
Autoconfiguration being enabled on these tests means that we also get a Sleuth component called Tracer that gives us flexibility in generating spans and trace contexts programmatically.
Of course, this means we must instrument the client side programmatically. This means extra code and of course the possibility of bugs. lets take a look at what this can mean for ‘maximal’ contact with the Tracer library.
ManualSpanTests.kt:
class ManualSpanTests : TestBase() {
// ...
    @Test
    fun `trace gets propagated with request`(@Autowired
                                        tracer: Tracer) {
        val manualSpan = tracer.spanBuilder()
                .kind(Span.Kind.CLIENT)
                .name("justMonoRequest")
                .tag("message","olleh")
                .remoteServiceName("EDDIEVALIANT")
                .start()

        StepVerifier.create(
                requester
                        .route("justMono")
                        .retrieveMono<String>()
                        .contextWrite { ctx ->
                            ctx.put(TraceContext::class.java, manualSpan.context())
                        }
                        .doOnError{ thrown ->
                            manualSpan.error(thrown)
                        }
                        .doFinally { sig ->
                            manualSpan.end()
                        }
        )
                .assertNext {
                    Assertions
                            .assertThat(it)
                            .isNotNull
                            .contains("olleh")
                }
                .verifyComplete()
    }
// ...
Instead of a plain request, we will also have metadata describing the trace context using B3 Propagation:
DEBUG [EDDIEVALIANT,,] 96092 --- [actor-tcp-nio-2] io.rsocket.FrameLogger                   : sending ->
Frame => Stream ID: 1 Type: REQUEST_RESPONSE Flags: 0b100000000 Length: 63
Metadata:
         +-------------------------------------------------+
         |  0  1  2  3  4  5  6  7  8  9  a  b  c  d  e  f |
+--------+-------------------------------------------------+----------------+
|00000000| fe 00 00 09 08 6a 75 73 74 4d 6f 6e 6f 01 62 33 |.....justMono.b3|
|00000010| 00 00 23 61 34 66 35 66 63 64 31 66 32 66 34 37 |..#a4f5fcd1f2f47|
|00000020| 35 39 32 2d 38 30 62 62 66 30 32 35 39 36 64 62 |592-80bbf02596db|
|00000030| 35 38 36 65 2d 31                               |586e-1          |
+--------+-------------------------------------------------+----------------+
On the server side with our created span in scope, we can observe it through the logs:
DEBUG [EDDIEVALIANT,a74a00e560eb60b7,3b339cb08d66a3f0] 57758 --- [ctor-http-nio-4] io.rsocket.FrameLogger                   : sending ->
Frame => Stream ID: 1 Type: NEXT_COMPLETE Flags: 0b1100000 Length: 11
Data:
         +-------------------------------------------------+
         |  0  1  2  3  4  5  6  7  8  9  a  b  c  d  e  f |
+--------+-------------------------------------------------+----------------+
|00000000| 6f 6c 6c 65 68                                  |olleh           |
+--------+-------------------------------------------------+----------------+
This is the server returning a payload ‘olleh’, with the FrameLogger output also bearing trace/span IDs. On the first line, we see a DEBUG log with trace info having a format by default [SERVICE_NAME, TRACE_ID, CURRENT_SPAN_ID]. Further info on logging formats are visible at the Sleuth Github. In the end, all other trace logs will look similar to what you’ve seen in the above scenarios.
Next, we will focus on the code side by utilizing some Spring Cloud Sleuth reactor instrumentation tools to do the work of wrapping our publishers. The next section will cover one such tool.
Removing the Boilerplate
There is much boilerplate in creating/setting/accessing trace state as in the above example. The developer will be required to also perform all the span closing and error handling logic. This work is better done in a specific component. That is where the ReactorSleuth class comes in to help us.
Luckily, the ReactorSleuth class acts as a factory for creating instrumented Publishers of which both Mono and Flux descend from. Let’s take it for a spin!
ManualSpanTests.kt
class ManualSpanTests : TestBase() {
//...
     @Test
    fun `ReactorSleuth will propagate hand-built span to justMono`(@Autowired tracer: Tracer) {
        val span = tracer.spanBuilder()
                .kind(Span.Kind.CLIENT)
                .name("reactorSleuth")
                .remoteServiceName("EDDIEVALLIANT")
                .start()

        StepVerifier
                .create(
                        ReactorSleuth.tracedMono(tracer, span) {
                            requester
                                    .route("justMono")
                                    .retrieveMono<String>()
                        }
                )
                .assertNext {
                    Assertions
                            .assertThat(it)
                            .isNotNull
                            .contains("olleh")
                }
                .verifyComplete()
    }
}
Upon execution of this test, you should see an output similar in structure to the manual trace generated in the previous example. At least this time we can expect that spans will be properly activated and ended while tagging any errors along the way.
Instrumentation Through Annotations
For us to make the code even cleaner (and easier to read) let’s create a client class with a @NewSpan annotated method that utilizes the RSocketRequester as we did in earlier tests. This client will do all the work of setting up a span in trace context:
SleuthyClient.kt:
@Component
class SleuthyClient() {
    @NewSpan("ClientOriginated")
    fun justMono(requester: RSocketRequester): Mono<String> =
            requester
                    .route("justMono")
                    .retrieveMono(String::class.java)
}
Then testing client calls becomes trivial. There exists a annotation specific test class AnnotatedSpanTests to highlight coverage of annotation based trace instrumentation.
AnnotatedSpanTests.kt
    @Test
    fun `client propagates trace to justMono endpoint`(@Autowired client: SleuthyClient) {
        StepVerifier
                .create(client.justMono(requester))
                .assertNext {
                    Assertions
                            .assertThat(it)
                            .isNotNull
                            .contains("olleh")
                }
                .verifyComplete()
    }
Running these tests shows our output to be similar to before but with different ID’s.
DEBUG [EDDIEVALIANT,,] 65632 --- [actor-tcp-nio-2] o.s.c.s.i.r.TracingRequesterRSocketProxy : Extracted result from context or thread local RealSpan(48291c184ddfb160/59252278c0be24d4)
DEBUG [EDDIEVALIANT,,] 65632 --- [actor-tcp-nio-2] io.rsocket.FrameLogger                   : sending ->
Frame => Stream ID: 1 Type: REQUEST_RESPONSE Flags: 0b100000000 Length: 63
Metadata:
         +-------------------------------------------------+
         |  0  1  2  3  4  5  6  7  8  9  a  b  c  d  e  f |
+--------+-------------------------------------------------+----------------+
|00000000| fe 00 00 09 08 6a 75 73 74 4d 6f 6e 6f 01 62 33 |.....justMono.b3|
|00000010| 00 00 23 34 38 32 39 31 63 31 38 34 64 64 66 62 |..#48291c184ddfb|
|00000020| 31 36 30 2d 35 39 32 35 32 32 37 38 63 30 62 65 |160-59252278c0be|
|00000030| 32 34 64 34 2d 31                               |24d4-1          |
+--------+-------------------------------------------------+----------------+
In the next section, we will configure the application to ship traces to a trace collection server - OpenZipkin.
Ship Traces to Zipkin
To understand the trace and not just keep logs, we need to send traces somewhere that can correlate them in a human-readable way. This is where OpenZipkin comes in. Zipkin supports a variety of trace collection transports - including Web, Kafka and RabbitMQ. The collector transport is configured at server startup. We will see examples of each configuration as the example progresses.
To ensure we have a satisfactory amount of trace data, lets setup the behaviour that determines how often our app will send trace data. This is especially helpful for preventing overload of any one kind of trace.
Sample Rate of Trace Shipments
Sleuth supports a few ways to tell it how often it should ship traces. This is configured in one of 2 ways: through the property prefix spring.sleuth.sampler, by setting a rate or probability property - e.g. spring.sleuth.sampler.probability=1.0 or spring.sleuth.sampler.rate=10. Alternately, we can create a @Bean of a brave.sampler.Sampler instance which also include static instances for Always and NEVER (the default) but you can even instantiate the RateLimited and Probabilistic` samplers this way.
For clarity, here are the 4 sampler strategies that are configurable through Spring Cloud Sleuth:
- NEVER_SAMPLE
- ALWAYS_SAMPLE
- RateLimited (per minute)
- Probabilistic ( 0.0 -> 1.0 )
In our case, we want ALWAYS sampling:
Application.kt
    @Bean
    fun sleuthTraceSampler(): Sampler {
        return Sampler.ALWAYS_SAMPLE
    }
Above, we will always ship traces to the configured collector. Collectors are the means which traces can arrive to our trace server (like OpenZipkin).
Spring Cloud Sleuth supports several traces transport strategies that are configured through the spring.zipkin.sender.type property in ZipkinSenderProperties. The supported ones are (of this writing):
- Web (Directly to Zipkin REST)
- Kafka (Zipkin via Kafka topic)
- RabbitMQ
- ActiveMQ
In this example, we create one profile per transmission strategy. First we will use the Web kind.
By Web
This solution involves docker compose and some YAML to bring up a Zipkin server. The following compose file will start up and leave Zipkin listening on port 9411.
services:
  zipkin:
    image: openzipkin/zipkin
    container_name: roger
    hostname: roger
    mem_limit: 512m
    expose:
      - "9411"
    ports:
      - "9411:9411"
    environment:
      - STORAGE_TYPE=mem
networks:
  default:
    name: sleuthy-rsocket_default
We can start the Zipkin server by executing the following command:
docker compose -f zipkin-compose.yml up
On the application side, create a properties file called application-zipkin.properties and store it in src/main/resources. This properties file is bound to the profile “rest” as its purpose is to set the URL for Zipkin connectivity as well as opt-in for HTTP/REST trace transport.
application-rest.properties:
spring.zipkin.sender.type=web
spring.zipkin.base-url=http://localhost:9411/
Finally, subclass the ManualSpanTests class we created earlier and set the active profile during the test as seen below:
ZipkinManualSpanTests.kt
@ActiveProfiles("rest")
class ZipkinManualSpanTests : ManualSpanTests()
Running these tests will emit traces that show similar logging data as before. Additionally, it will send those traces to the local Zipkin server. Next, we will take a look at viewing these logs in the Zipkin user interface.
Accessing Trace Graphs in Zipkin
With the configuration out of the way, we can execute our tests, then log into the Zipkin server (localhost:9411 or what you have configured) to see some traces. We will query Zipkin for a serviceName with ‘EDDIEVALLIANT’.
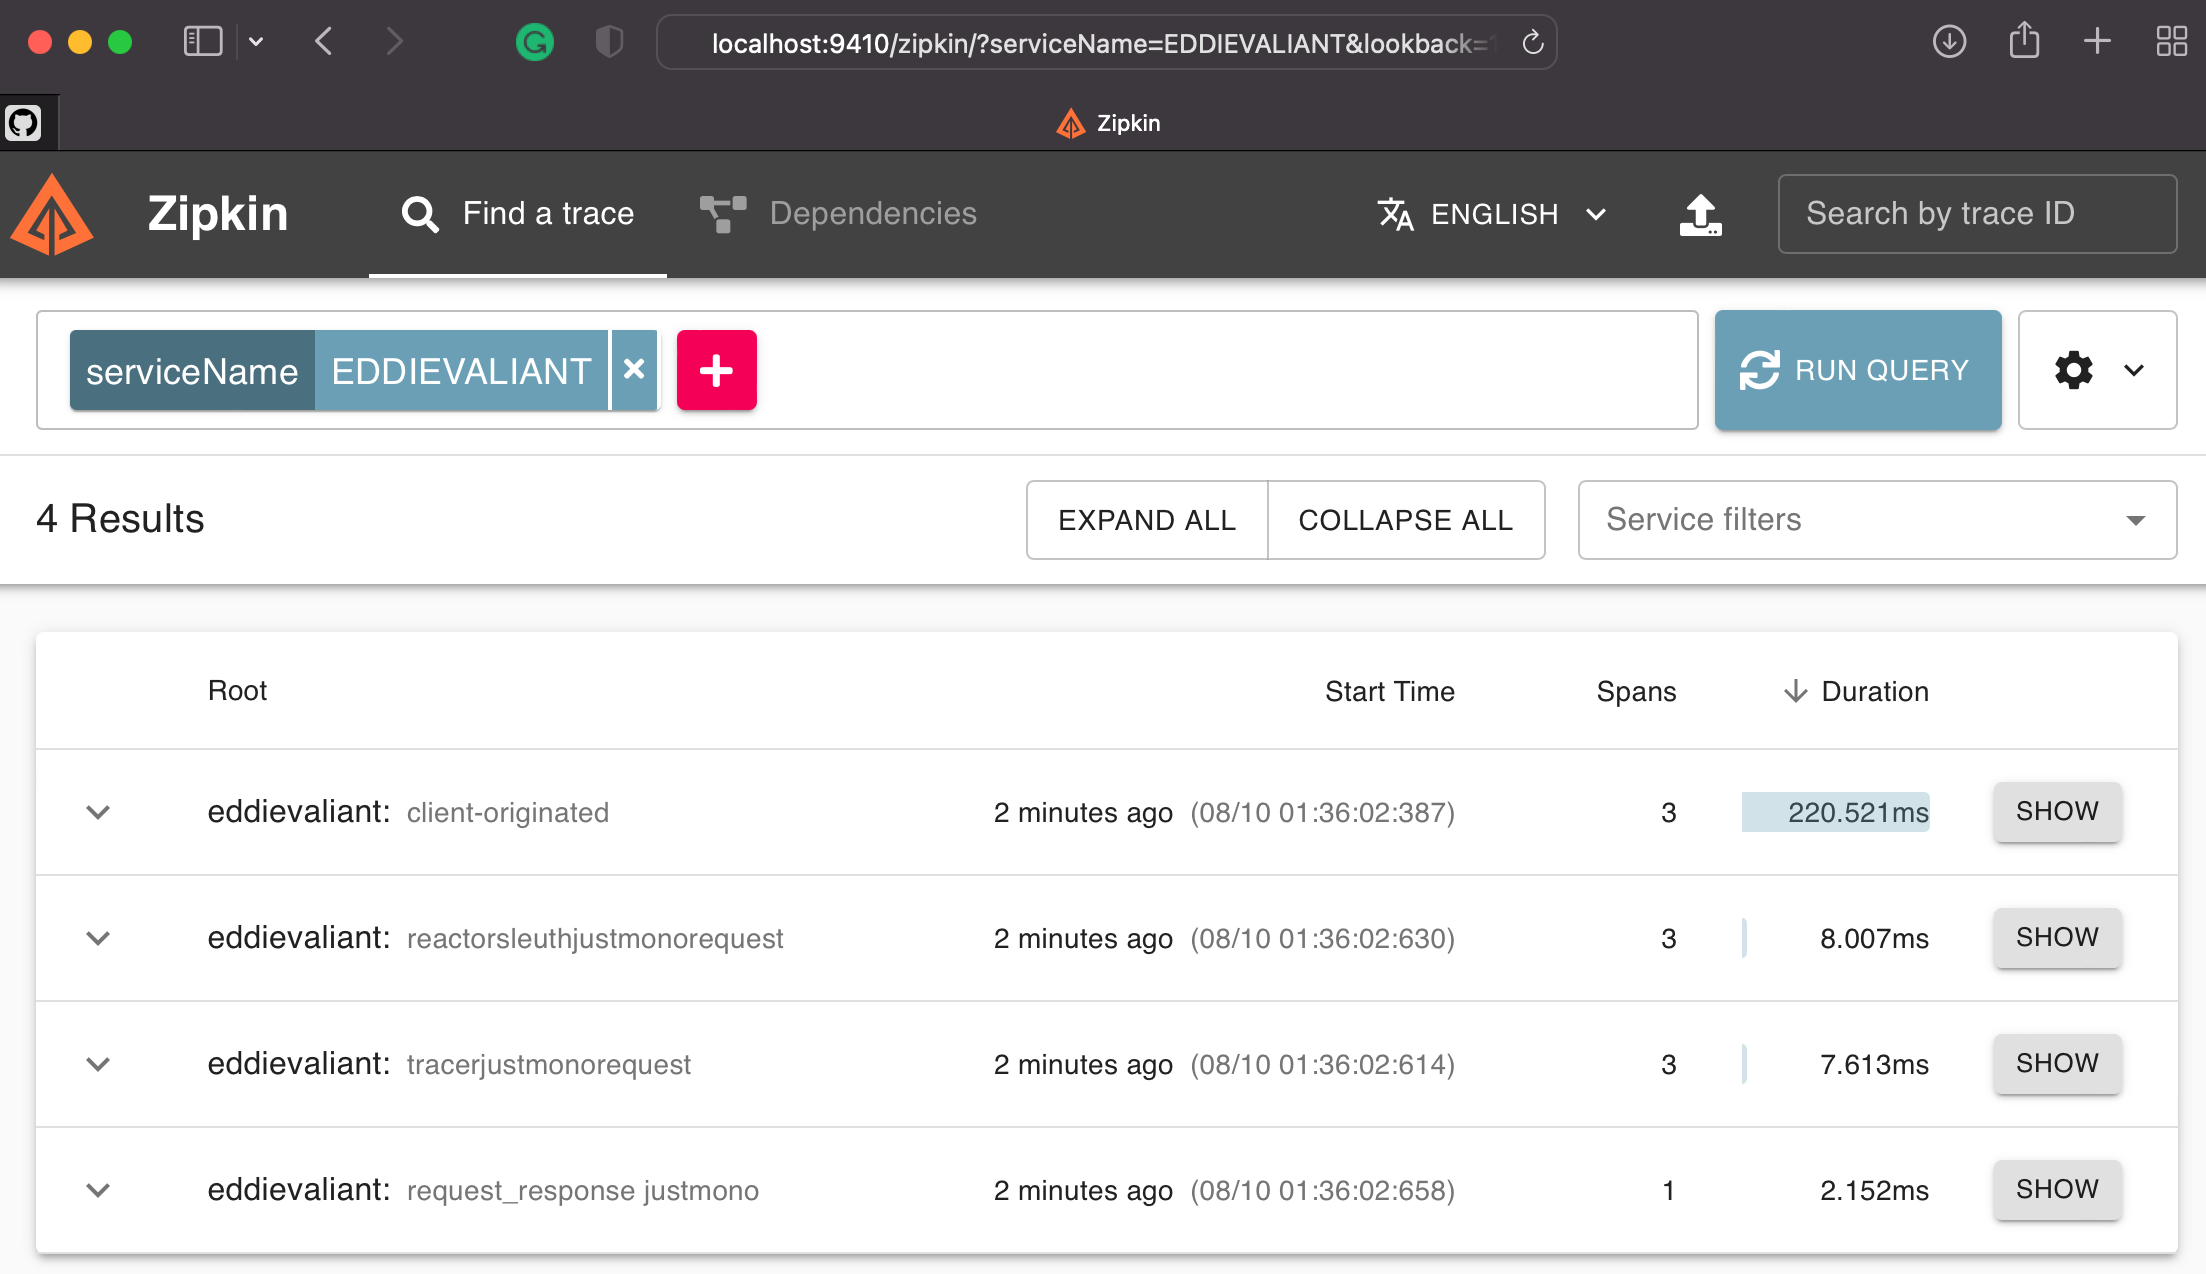
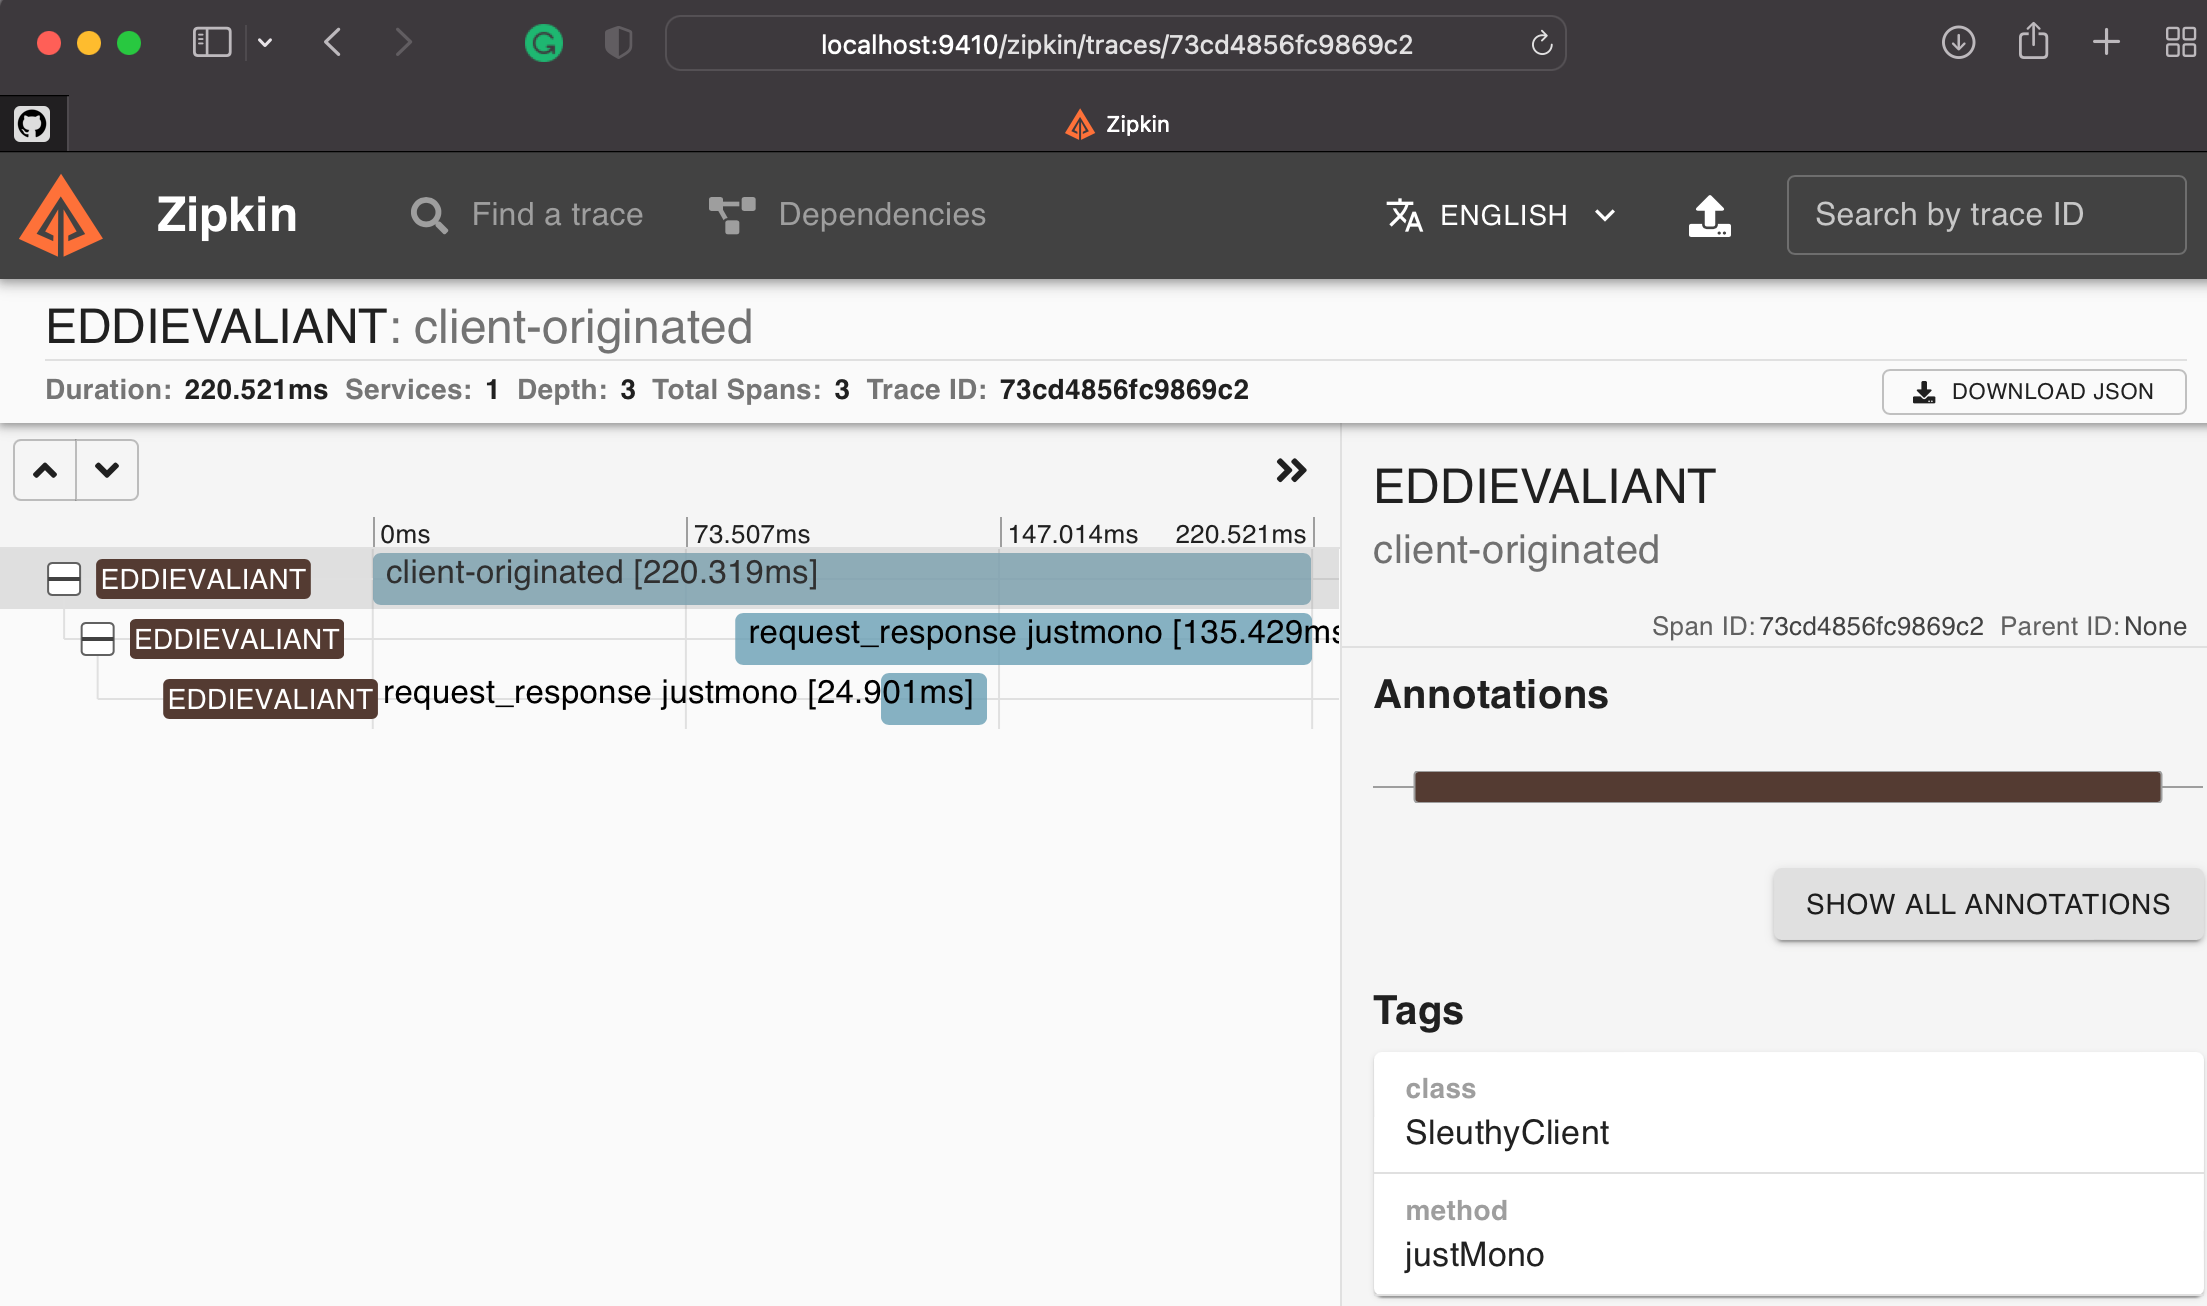
We can drill down into the first client-originated request by clicking on ‘SHOW’. The UI response will be similar to the following.
To continue, you will then need to shut down this service using the compose command:
docker compose -f zipkin-compose.yml down
Zipkin by way of Kafka
As an alternative to HTTP/REST, we can also push messages to Zipkin via Kafka. On the app side, Sleuth spring-kafka dependency on the classpath enables us to set up connectivity for Sleuth to send traces over Kafka topics.
The Kafka dependency is of the org.springramework.kafka:spring-kafka variety and lets us send traces directly into Kafka for reception by a Zipkin server downstream. This is enabled on our application with a few edits.
First, update to pom.xml for Kafka connectivity:
pom.xml
		<dependency>
			<groupId>org.springframework.kafka</groupId>
			<artifactId>spring-kafka</artifactId>
		</dependency>
Tell Sleuth we want to ship traces through the Kafka topic by setting the spring.zipkin.sender.type. Additionally, by introducing a new profile-specific properties, we can configure the Kafka connection as shown below:
application-kafka.properties
spring.sleuth.messaging.kafka.enabled=true
spring.sleuth.messaging.kafka.mapper.enabled=true
spring.sleuth.messaging.kafka.remote-service-name=broker
spring.zipkin.sender.type=kafka
spring.zipkin.kafka.topic=zipkin
Above, we set Kafka specific sleuth properties that tell sleuth things like ‘remote-service-name’ and which ’topic’ to send to.
On the code side, we will subclass the ManualSpanTests class with one marked with @ActiveProfiles("kafka") annotation. In this way, each test class runs the same tests but ships to a kafka server for collection later on by the Zipkin Kafka Collector.
KafkaManualSpanTests.kt
@ActiveProfiles("kafka")
class KafkaManualSpanTests : ManualSpanTests()
Starting up Kafka for Zipkin
Before testing, we will need to stand up an infrastructure scenario using Docker Compose. This compose file will configure a full distribution of Zookeeper, Kafka, and Zipkin which will be configured to connect to Kafka and consume from a topic. The properties we are interested in here are shown in the compose file:
kafka-compose.yml
---
version: '3'
services:
  zookeeper:
    image: confluentinc/cp-zookeeper:7.0.1
    container_name: zookeeper
    environment:
      ZOOKEEPER_CLIENT_PORT: 2181
      ZOOKEEPER_TICK_TIME: 2000

  broker:
    image: confluentinc/cp-kafka:7.0.1
    container_name: broker
    expose:
      - "9092"
      - "19092"
    ports:
      # To learn about configuring Kafka for access across networks see  ( DO READ THIS IF YOU HAVE PROBLEM )
      # https://www.confluent.io/blog/kafka-client-cannot-connect-to-broker-on-aws-on-docker-etc/
      - "9092:9092"
    depends_on:
      - zookeeper
    environment:
      KAFKA_BROKER_ID: 1
      KAFKA_ZOOKEEPER_CONNECT: 'zookeeper:2181'
      KAFKA_LISTENER_SECURITY_PROTOCOL_MAP: PLAINTEXT:PLAINTEXT,PLAINTEXT_INTERNAL:PLAINTEXT
      KAFKA_ADVERTISED_LISTENERS: PLAINTEXT://broker:9092,PLAINTEXT_INTERNAL://localhost:19092
      KAFKA_OFFSETS_TOPIC_REPLICATION_FACTOR: 1
      KAFKA_TRANSACTION_STATE_LOG_MIN_ISR: 1
      KAFKA_TRANSACTION_STATE_LOG_REPLICATION_FACTOR: 1

  zipkin:
    image: openzipkin/zipkin
    container_name: zipkin
    mem_limit: 512m
    expose:
      - "9411"
    ports:
      - "9410:9411"
    depends_on:
      - broker
    environment:
      - KAFKA_BOOTSTRAP_SERVERS=broker:9092
      - STORAGE_TYPE=mem
      - JAVA_OPTS=-Dlogging.level.zipkin=INFO -Dlogging.level.zipkin2=INFO -Dlogging.level.org.apache.kafka=INFO
Importantly, as noted above we need to let the Zipkin server know where Kafka is by setting the KAFKA_BOOTSTRAP_SERVERS to the host of the Kafka server. However, by default we let Zipkin specify its default topic ‘zipkin’. You can override this by setting the ‘KAFKA_TOPIC’ environment. For more information related to Zipkin/Kafka collection, check out the OpenZipkin github document related to these options.
Perform the next necessary step - standing up the servers - by executing the docker-compose file:
docker compose -f kafka-compose.yml up
Zipkin by way of RabbitMQ
Another alternative lets us push traces to Zipkin via RabbitMQ. Including the spring-boot-starter-amqp dependency on the classpath enables us to set up connectivity for Sleuth to send traces over Rabbit Queues.
pom.xml
		<dependency>
			<groupId>org.springframework.boot</groupId>
			<artifactId>spring-boot-starter-amqp</artifactId>
		</dependency>
Tell Sleuth we want to ship traces through queue by setting spring.zipkin.sender.type to ‘rabbit’. Additionally, by introducing a new profile-specific properties file to fill in parameters of the AMQP/RabbitMQ connection as shown below:
application-rabbit.properties
spring.sleuth.messaging.rabbit.enabled=true
spring.sleuth.messaging.rabbit.remote-service-name=localhost
spring.zipkin.rabbitmq.addresses=localhost
spring.zipkin.sender.type=rabbit
spring.zipkin.rabbitmq.queue=zipkin
Above, we set RabbitMQ specific sleuth properties that tell sleuth things like ‘remote-service-name’ and which ‘queue’ to send to.
The code side is similar to what we did with Kafka. Subclass ManualSpanTests with one marked with @ActiveProfiles. The profile we choose this time is ‘rabbit’.
KafkaManualSpanTests.kt
@ActiveProfiles("kafka")
class KafkaManualSpanTests : ManualSpanTests()
When testing is complete, shut down the Kafka infrastructure using the following command:
docker compose -f kafka-compose.yml down
Starting up RabbitMQ for Zipkin
Another infrastructure scenario is needed to furnish our application with connectivity to Zipkin and RabbitMQ. The configuration properties we are interested in are shown in the compose file below:
rabbit-compose.yml
services:
  rabbitmq:
    image: rabbitmq:3-management
    container_name: roger
    hostname: roger
    mem_limit: 350m
    expose:
      - "5672"
      - "15672"
    ports:
      - 5672:5672
      - 15672:15672
    healthcheck:
      test: [ "CMD", "rabbitmqctl", "status" ]
      interval: 10s
      timeout: 5s
      retries: 10

  zipkin:
    image: openzipkin/zipkin
    container_name: zipkin
    hostname: zipkin
    mem_limit: 512m
    expose:
      - "9411"
    ports:
      - "9411:9411"
    environment:
      - "RABBIT_URI=amqp://guest:guest@roger:5672"
      - STORAGE_TYPE=mem
    depends_on:
      rabbitmq:
        condition: service_healthy
Importantly, as noted above we need to let the Zipkin server know where RabbitMQ is by setting the RABBIT_URI to the host of the RabbitMQ server. However, by default we let Zipkin specify its default queue ‘zipkin’. You can override this by setting the ‘RABBIT_QUEUE’ environment. For more information related to Zipkin/Rabbit collection, check out the OpenZipkin github document related to these options.
Perform the next necessary step - standing up the servers - by executing the docker-compose file:
docker compose -f rabbit-compose.yml up
Running RabbitManualSpanTests will show very similar results - only the SpanId will differ. With that, we conclude shipping traces through RabbitMQ.
To tear down the RabbitMQ scenario in compose:
docker compose -f rabbit-compose.yml down
Closing
This guide was meant to introduce you to Spring Boot, Kotlin, and distributed tracing as a topic of interest to enterprise-driven or even startup-driven developers. The main concepts in this topic described the flexibility in options given when configuring a traced RSocket microservice. The key takeaways for you are that Sleuth is based on research and tested technology that is well understood and in use on a global scale on the internet right now. That RSocket microservices can be instrumented in Spring Boot, with the Kotlin side being well supported - even with coroutines!
Informational and Learning Material
Distributed Tracing Best Practices
How to change the context propagation mechanism
Git Issue Adding RSocket Support Thanks to Marcin Grzejszczak and toomuchoding.com
Git Issue Adding Prometheus Exemplars Support #2039 Thanks to Jonatan Ivanov